What a workbook analysis really reveals and why not everything that looks wrong actually is
FAQ - What Does This Article Answer?
What does a workbook analysis tool actually check?
A: It examines three things: the names and named ranges used in formulas; the styles and number formats applied to cells; and the structural health of each sheet, including cell counts, waste percentages, error results and conditional formatting volume. Together, these three analyses provide a comprehensive overview of the contents of a workbook, its structure, and potential problem areas.
Q: Why do I see hundreds of named ranges I never created?
A: If your workbook uses modern Excel 365 functions, such as LET or LAMBDA, Excel will automatically register the parameter names that you define within these functions as entries for named ranges in the workbook's Name Manager. These entries appear with a usage count of zero because, technically, they are not named ranges; rather, they are formula variable definitions. Deleting them will break any formulas that depend on them.
Q: What does a waste percentage of 99% mean?
A: The waste percentage shows what proportion of a sheet's 'used range' contains no data. Excel defines the 'used range' as the area from cell A1 to the furthest right and furthest down cell that was ever selected, even if it was subsequently cleared. A waste percentage of 99% means that the actual content of the sheet occupies only 1% of the range that Excel thinks it needs to manage. This slows down opening, saving and scrolling. This issue can usually be resolved by resetting the used range.
Q: Are millions of conditional format records a serious problem?
A: Yes, but only in terms of performance, not correctness. Applying conditional formatting to entire columns rather than specific data ranges creates a large number of internal records without affecting the visual result. While the workbook calculates and displays correctly, it opens and saves slowly and becomes difficult to share. Care is required when cleaning conditional formatting, as removing it from the wrong cells can destroy the visual design of the sheet.
Q: What is the difference between something that can be cleaned and something that cannot?
A: The key distinction is between structural and visual/performance data. Named ranges that are LAMBDA or LET parameter definitions are structural; removing them breaks formulas. Conditional formatting applied to empty columns is visual/performance data. Removing it from the empty area has no visual effect, but improves performance. Unused built-in styles are pure overhead and removing them has no effect. A good analysis tool should be able to identify all three categories. A good consultant knows which is which before making any changes.
Running a workbook analysis tool for the first time can be alarming.
You may see hundreds of named ranges that you never created. Millions of conditional formatting records. Waste percentages above 99%. The file size is larger than it should be. Not to mention a Name Manager full of entries with cryptic labels such as '_xlpm.startDates' and '_xlpm.monthlyDays' that you have never seen before and do not understand.
Your instinct is to clean everything. Delete the unused names. Remove the excess formatting. Reset the ranges.
If applied without understanding, that instinct will break a professionally built workbook.
This article provides a detailed analysis of a project cost baseline workbook, explaining the meaning of each finding, which parts are safe to clean and which must never be touched, even if they appear incorrect.
The workbook under analysis
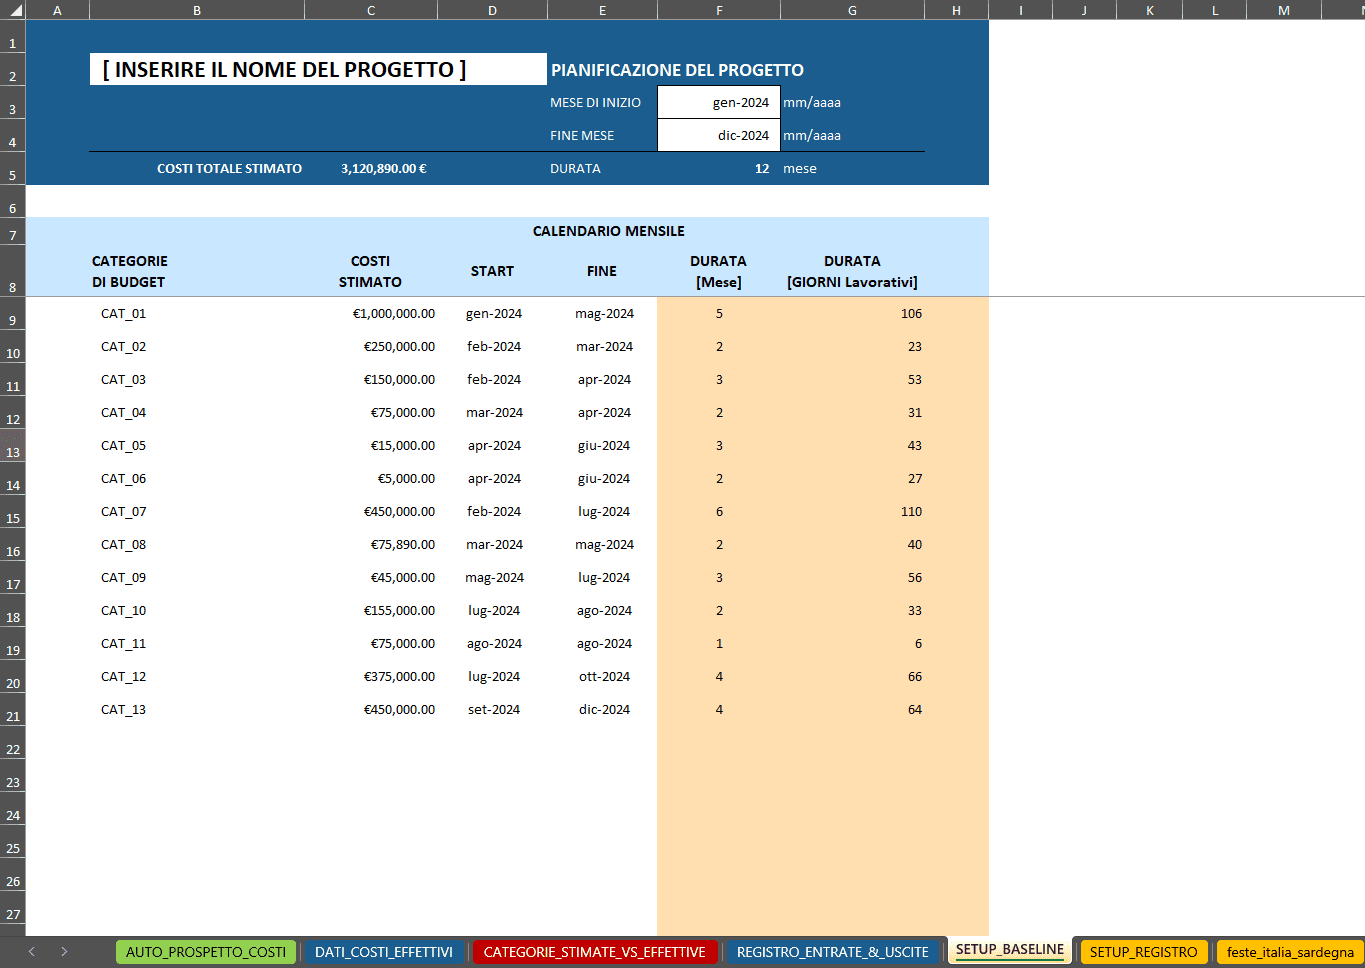
The workbook serves as a project cost baseline and expenditure schedule. As a financial planning tool, it distributes estimated project costs across monthly periods, tracks actual costs against the baseline and generates cumulative spending curves and variance reports.
It covers a project comprising 13 budget categories, running from January to December 2024. When calculating working days, it accounts for Italian national public holidays and Sardinian regional holidays. Four chart-based output views are produced from a single data entry sheet.
It is built entirely in Microsoft Excel 365 using named ranges, dynamic array formulas, LET, LAMBDA and MAKEARRAY — the most modern Excel formula architecture available.
The three analysis tools
Three separate analysis modules were run on this workbook. Each one reveals a different layer of information.

The diagram above illustrates how the three tools are related to the workbook and the information that each one is designed to reveal. What follows is a detailed walkthrough of each tool.
Analysis 1: Names map (FastXLMap1)
What it shows
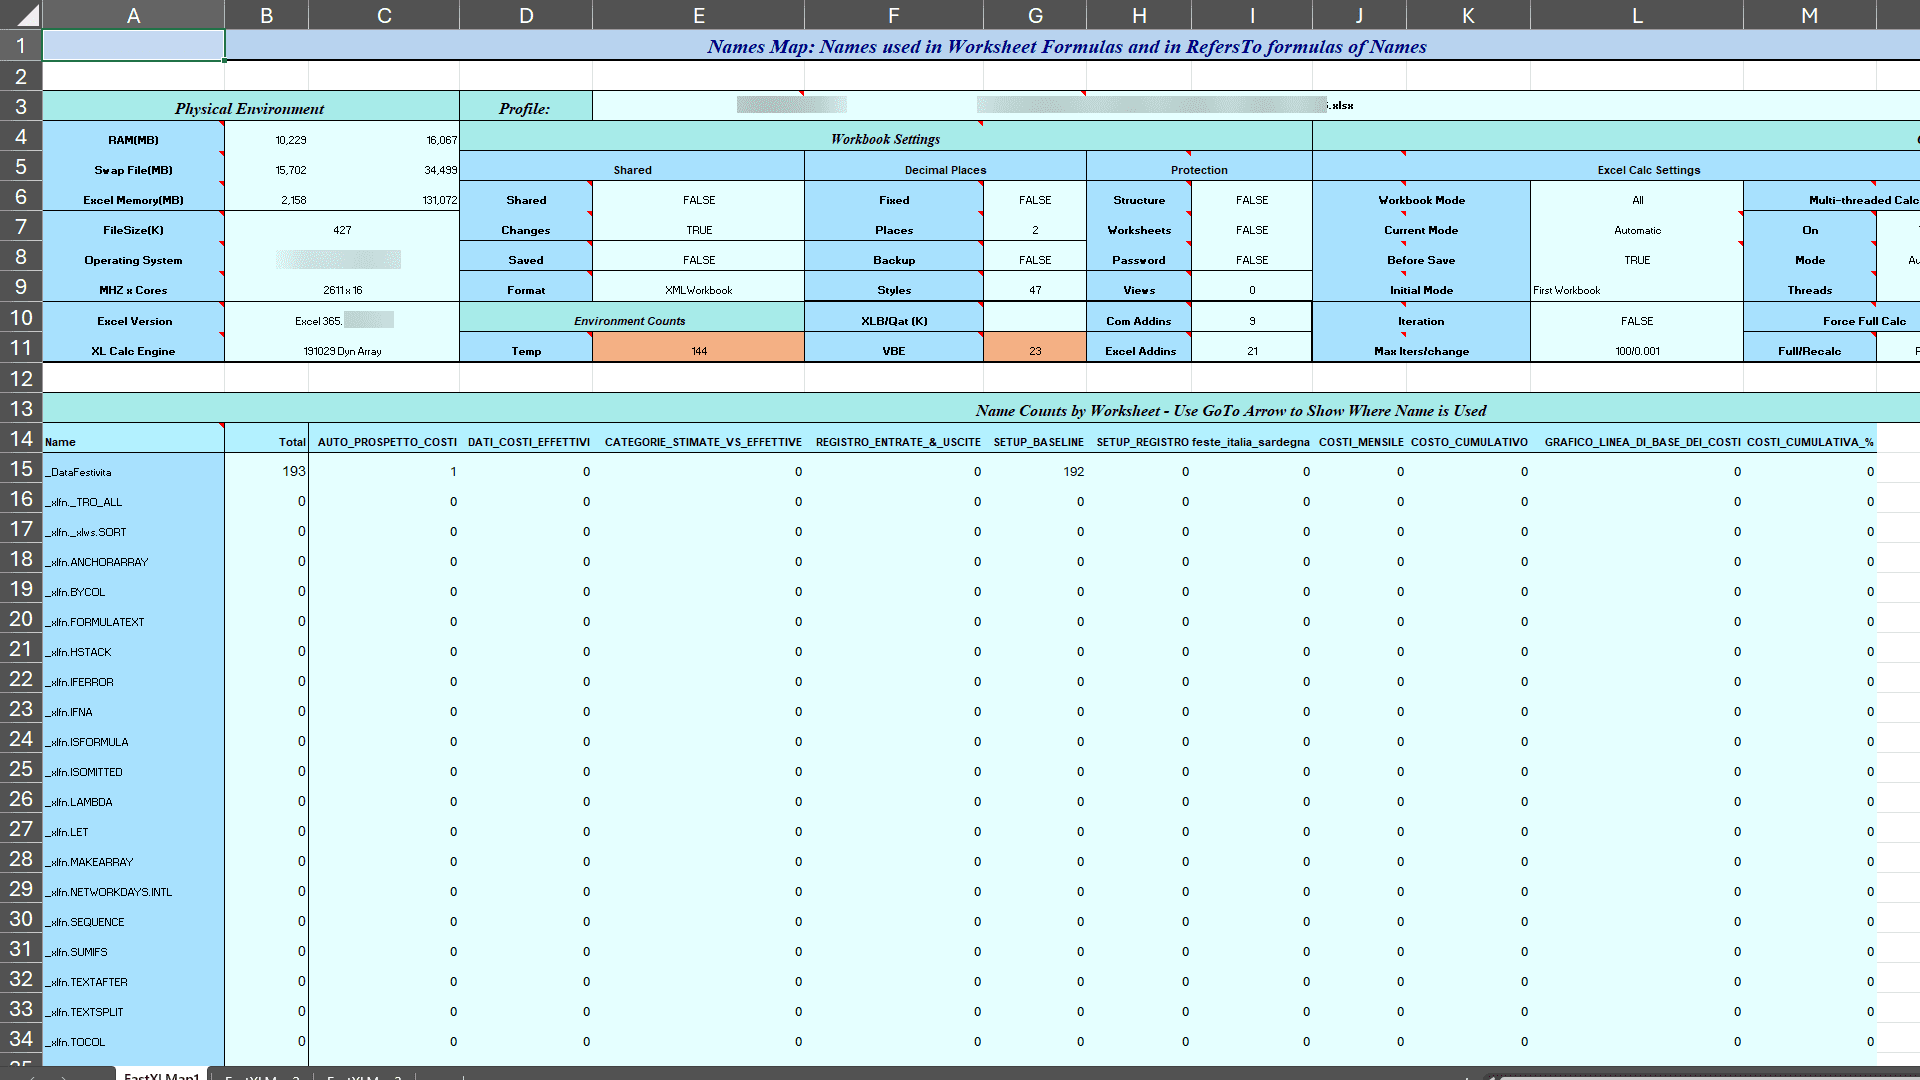
The Names map is a list of all the named ranges and named formulas in the workbook. It shows how many times each one is used and how often it appears on each sheet.
What we found
The workbook contains a total of 82 named entries. Of these, only a few have a usage count above zero.
| Name | Total uses | Primary location |
|---|---|---|
_DataFestivita |
193 | SETUP_BASELINE (192 times) |
PROJECTNAME |
14 | 8 sheets |
COSTESTIMATE |
3 | AUTO_PROSPETTO + DATI_COSTI |
ACTUALSTARTDATE |
3 | AUTO_PROSPETTO + DATI_COSTI |
col |
12 | AUTO_PROSPETTO + DATI_COSTI |
The remaining 77 entries all have a usage count of zero. These include entries with names such as: _xlpm.startDates, _xlpm.endDates, _xlpm.taskAmounts, _xlpm.totalDays, _xlpm.headerDates, _xlpm.dailyRate, _xlpm.monthlyAmount and several others.
The critical finding is that what looks like a problem is not.
To an automated clean-up tool, 77 unused named ranges look like 77 things to delete. The same conclusion would naturally follow for someone who does not know what they are looking at.
However, these are not unused named ranges. They are the internal parameter definitions of LAMBDA and LET formulas.
When processing a formula that uses LET or LAMBDA with named parameters, such as LET(startDates, C9:C21, endDates, D9:D21, ...), Excel 365 registers each parameter name in the workbook name manager. This registration uses the prefix _xlpm., followed by the parameter name. This enables the calculation engine to keep track of what each variable means during formula evaluation.
The usage count appears as zero because FastExcel counts these as named ranges rather than formula parameter definitions. They sit in a different functional category. However, they are not optional entries that can be removed. They are part of the formula's internal wiring.
In some cases, deleting them does not produce an immediate visible error. However, it can destabilise the formula architecture, cause incorrect results in specific calculation scenarios and render the workbook unmaintainable for anyone who tries to edit the formulas later on.
One of the most important things a diagnostic tool can show you is not just what is there, but also what category it belongs to. It is also one of the most important things a consultant can know: when not to clean.
What IS safe to clean in this analysis
ACTUALDURATION, DDL_SORTER and DURATA_GGL are named ranges that exist in the Name Manager, but are unused and not connected to any active formula. These can be removed.
The two inconsistent Italian locale codes, [$-410] and [$-10410], identified in the styles map (see below) are a mild inconsistency that can be unified without affecting any calculation.
Analysis 2: Workbook check (FastXLCheck1)
What it shows
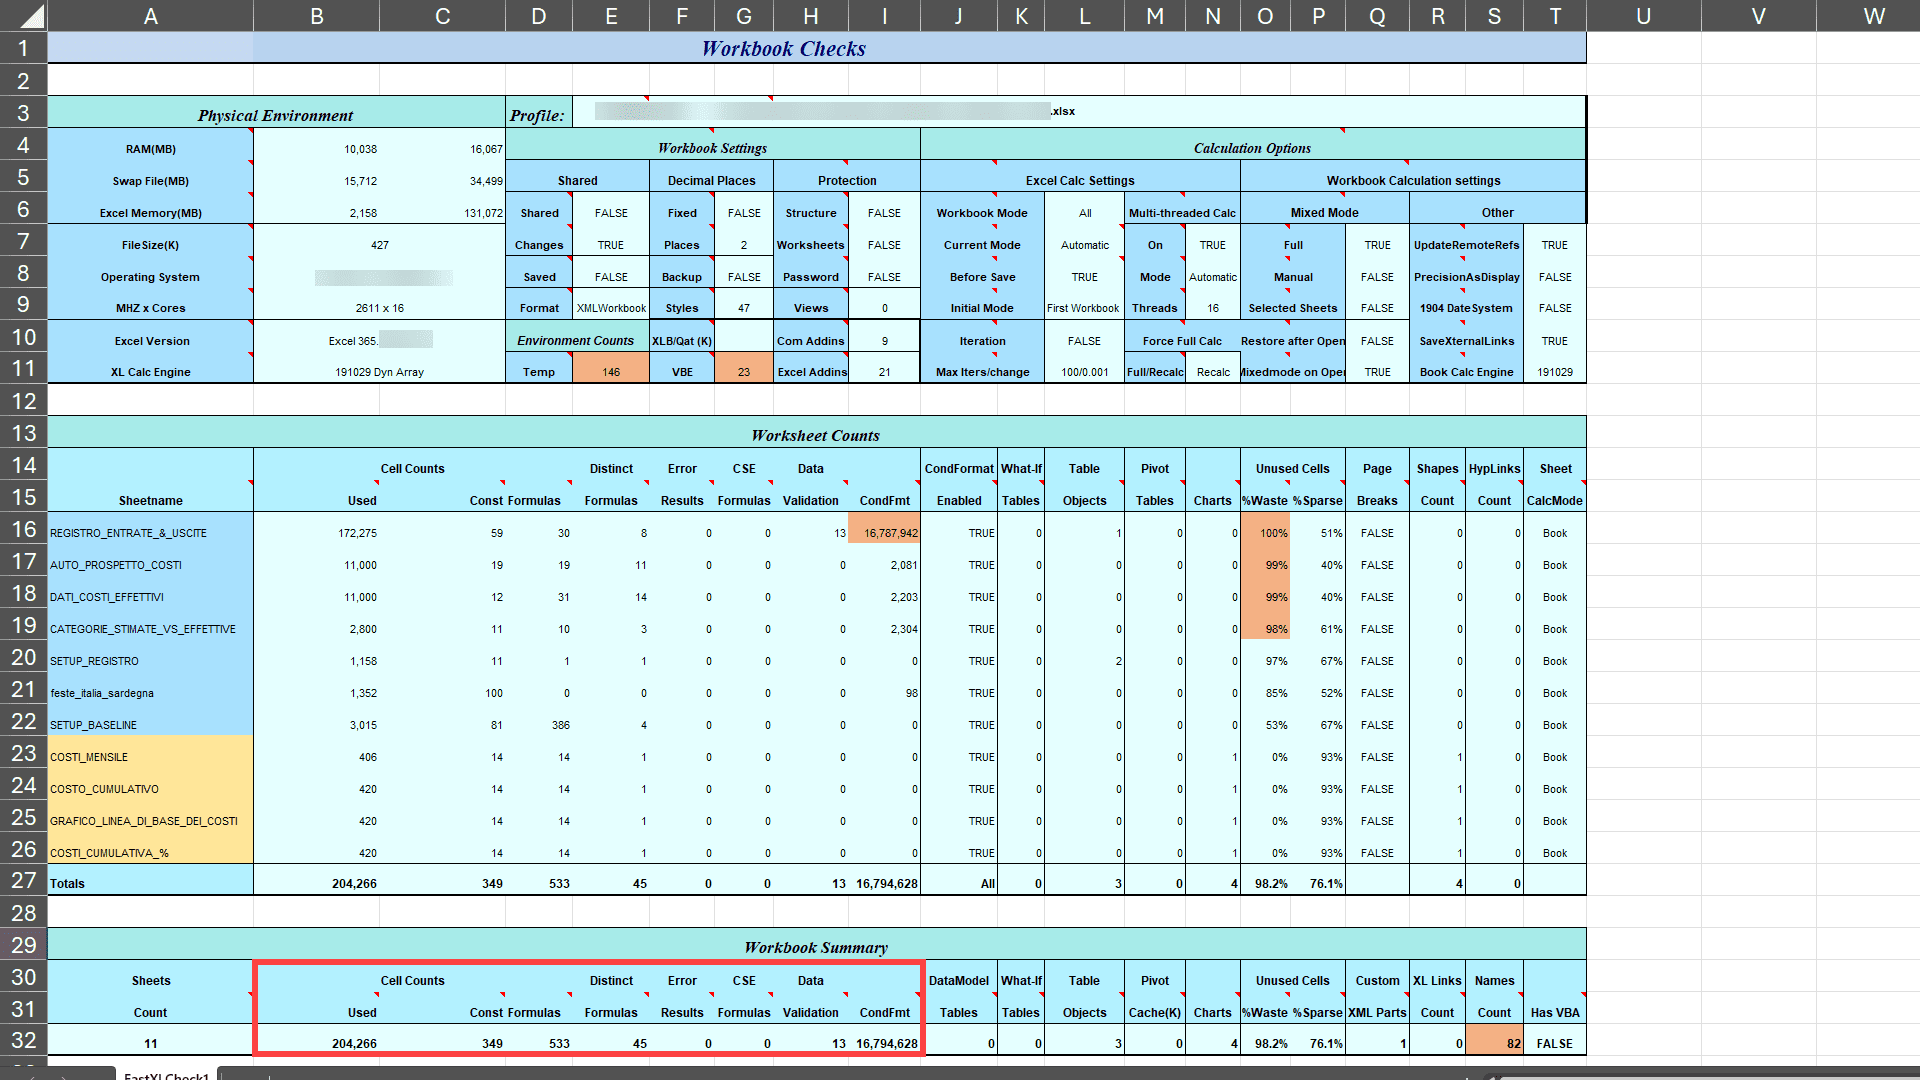
The workbook check produces a row for each sheet, showing the number of cells, formulas, distinct formulas, error results, CSE formulas (old-style array formulas), data validations, conditional formatting records, wasted percentage and sparse percentage.
The headline numbers
| Metric | Value | Meaning |
|---|---|---|
| Total used cells | 204,266 | Expected for this size |
| Total formulas | 533 | Reasonable |
| Distinct formulas | 45 | Only 45 unique patterns |
| Error results | 0 | No broken formulas |
| CSE array formulas | 0 | No old-style arrays |
| Conditional format records | 16,794,628 | The main problem |
| Overall waste | 98.2% | Needs attention |
Finding 1: Zero errors and zero CSE formulas
This is the most important quality indicator in the entire analysis. The fact that a workbook with 533 formulas has zero errors means that every calculation is working correctly. Nothing is broken. No formula is producing the wrong answer. The workbook is doing exactly what it is supposed to do.
The zero CSE count confirms that all array formulas use the modern dynamic array approach, rather than the old-style Ctrl+Shift+Enter formulas which are fragile, difficult to edit, and incompatible with newer Excel features.
Finding 2: 45 distinct formulas drive 533 total
This ratio reveals information about the quality of the architecture. There are only 45 unique formula patterns across 533 formula cells. This means that most formulas are repetitions of the same logic applied to different rows or columns, which is exactly how a well-designed workbook should function.
If every cell had its own custom formula, maintaining the workbook would be extremely difficult. With just 45 patterns repeated consistently, a single change to the logic is propagated correctly throughout the entire structure.
Finding 3: 16.8 million conditional format records
This is the real problem. It lives almost entirely in one sheet: REGISTRO_ENTRATE_&_USCITE, the income and expenditure ledger.
This ledger contains 172,275 used cells, but an astonishing 16,787,942 conditional formatting records. This ratio would not be possible if conditional formatting had only been applied to the data area. This suggests that the conditional formatting rules were applied to entire columns — all 1,048,576 rows — rather than just the rows containing data.
This is invisible to the user looking at the screen. The colours display correctly. The ledger looks fine. However, internally, Excel evaluates the conditional formatting rules against millions of empty cells with every recalculation, save and open. This is why the file takes longer than it should to open, and why saving feels slow.
Finding 4: Waste percentages by sheet
The waste percentage shows how far each sheet's used range extends beyond its actual content, which is useful for determining how much of the sheet is actually used.
| Sheet | Waste % | Interpretation |
|---|---|---|
| REGISTRO_ENTRATE | 99.9% | Formulas/formatting extend to row 1,048,576 |
| AUTO_PROSPETTO | 99.4% | Used range extends beyond content |
| DATI_COSTI | 99.3% | Same issue |
| SETUP_BASELINE | 53.3% | Acceptably clean |
| Output chart sheets | 0% | Perfectly clean |
The relatively low waste percentage of SETUP_BASELINE confirms that it was built carefully — the used range is close to the actual content area. The cleanest sheets in the workbook are the output chart sheets at 0%, because they contain only the minimum required for their charts.
The high waste percentage in the main calculation sheets indicates a performance issue rather than an accuracy issue. The formulas calculate correctly. However, Excel manages a much larger range than necessary for every operation.
Analysis 3: Styles map (FastXLMap2 and FastXLMap3)
What it shows
Two components make up the styles map: the cell style count and the number format count, both per sheet.
Cell styles, only one is actually used
The workbook contains 47 cell styles, comprising the entire range of built-in Excel styles, including 'Good', 'Bad', 'Heading 1' through 'Heading 4', 'Input', 'Output', 'Calculation', 'Warning Text', and all the Accent percentage variants.
Not a single one of them is used across all 11 sheets. The entire workbook uses only one style: Normal.
This is a deliberate professional decision. Visual differentiation is handled entirely through custom number formats, rather than named styles. Named styles can cause unexpected visual changes when workbooks are copied between environments or merged with other files. Eliminating them entirely makes the workbook more portable and predictable.
The 46 unused built-in styles increase file size without offering any benefits. Unlike the named range entries, they have no connection to any formula or calculation, so they are genuinely safe to remove.
Number formats: a consistent and intentional set
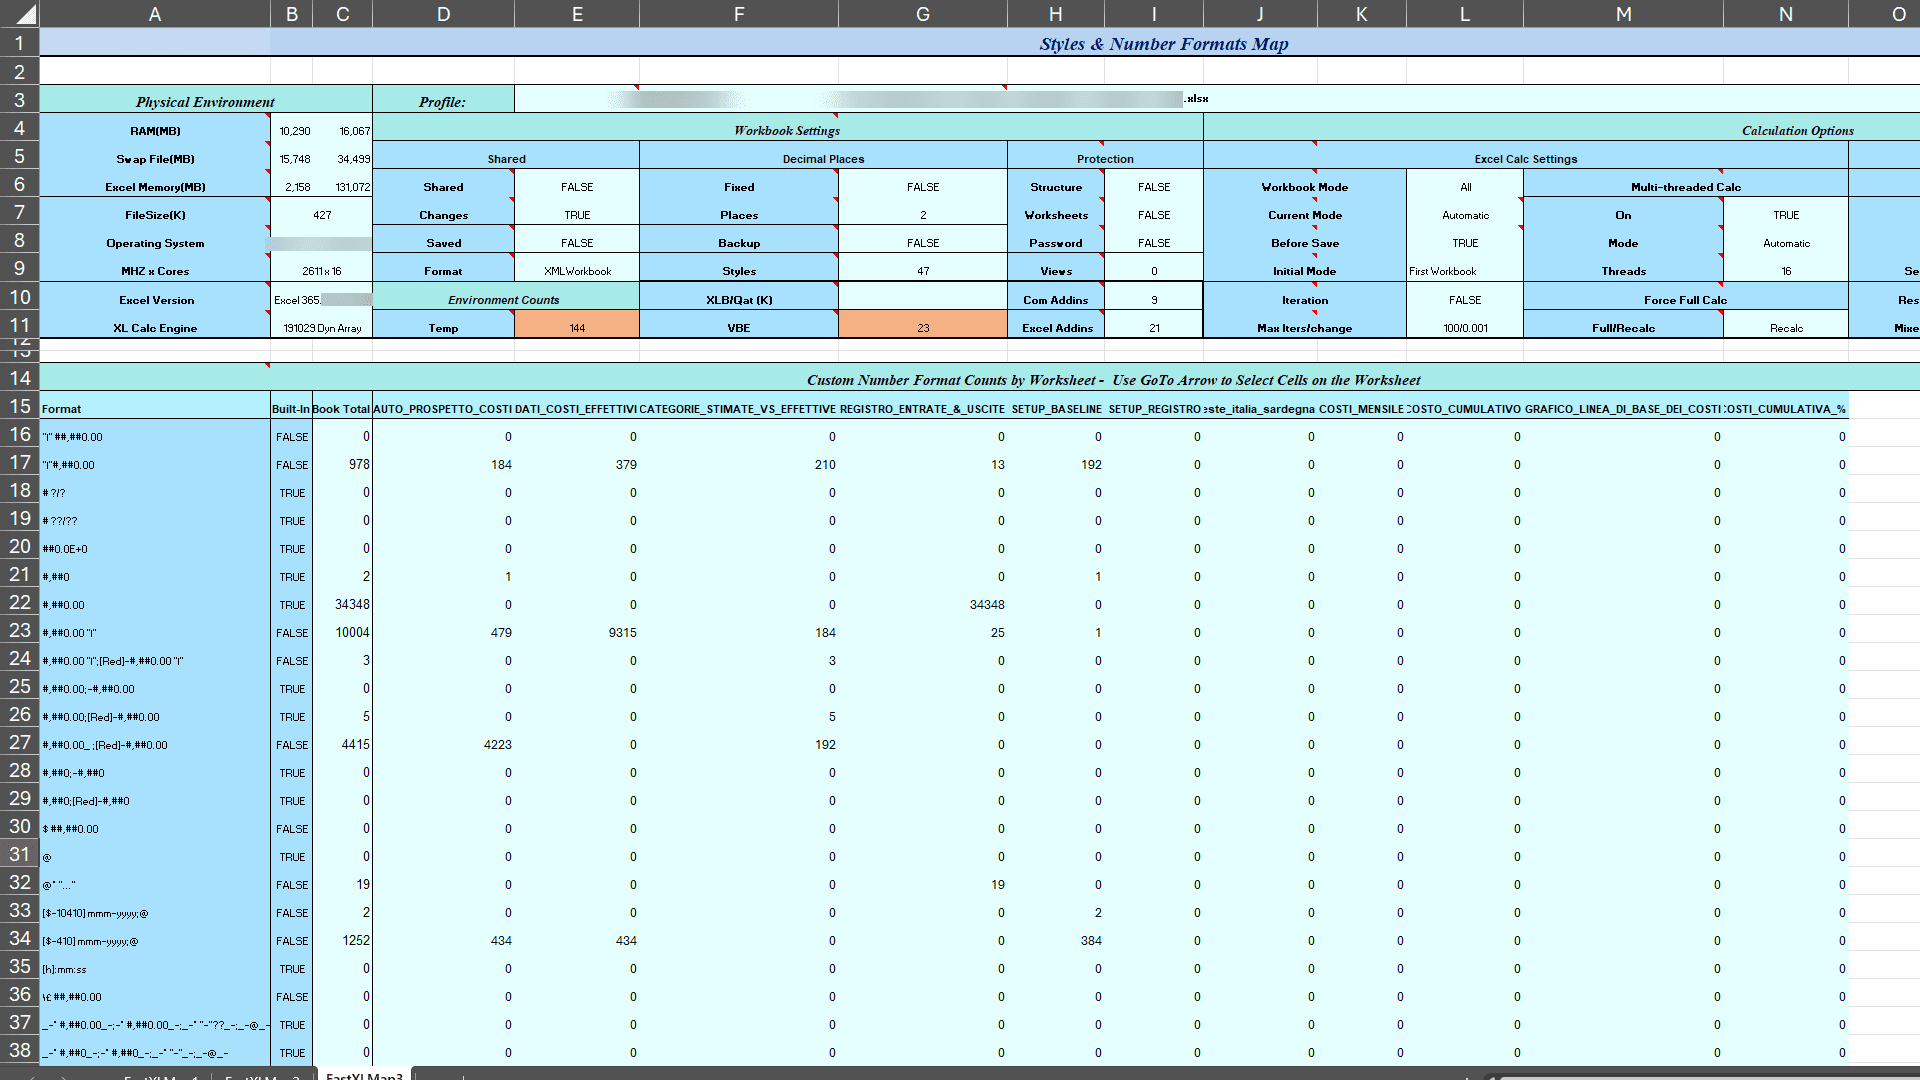
The number formats tell a precise story about how the workbook was designed:
"€"#,##0.00 is used 978 times across five sheets and is the primary euro currency format for all financial figures.
#,##0.00 "€" is used 10,004 times, mostly in DATI_COSTI_EFFETTIVI, reflecting the Italian convention of placing the euro symbol after the number. Both conventions exist in the workbook intentionally, reflecting its use in both international and Italian contexts.
The Italian locale format, [$-410] mmm-yyyy;@, is used 1,252 times in the column headers of the cost schedule. This format displays dates in Italian month abbreviations, e.g. 'Gen-2024', 'Feb-2024'. The [$-410] is the Italian locale code.
Two cells in SETUP_BASELINE use the variant code [$-10410]. Unifying this minor inconsistency is the only formatting issue that should be addressed.
dd/mm/yyyy covers 11,522 cells in the ledger, with consistent date formatting throughout the transaction register.
@* "..." appears 19 times in the ledger, providing a text format with ellipsis padding that visually fills the column width. A subtle but professional touch.
What the analysis tells us overall
Three analyses, three layers of information and one coherent picture.
The workbook is architecturally sound. Every formula is calculated correctly. The structure is consistent, with 45 distinct patterns driving 533 formulas. The named ranges that appeared to be redundant are actually the parameter definitions of a sophisticated, modern formula architecture and must not be deleted.
The real problems are performance-related, not accuracy-related. Conditional formatting has been applied to entire columns. Used ranges extend far beyond their content. These affect speed, not accuracy. They can be addressed, but only by someone who understands which cells to clean and which to leave untouched.
This is precisely the distinction between a workbook analysis and a workbook clean. An analysis tells you what is there. Understanding tells you what it means. Expertise tells you what to do about it and what to leave alone.
Summary: what to clean and what to keep
| Finding | Category | Action |
|---|---|---|
_xlpm.* named ranges |
LAMBDA/LET parameters | Leave untouched — part of formula architecture |
_DataFestivita named range |
Active named range | Leave untouched — used 193 times |
| 16.8M conditional format records | Performance bloat | Clean carefully — remove from empty rows only |
| 99%+ waste in main sheets | Used range bloat | Reset used range after cleaning |
| 46 unused built-in styles | File overhead | Safe to remove |
[$-10410] locale inconsistency |
Minor formatting | Unify to [$-410] |
| Genuinely unused named ranges | Dead entries | Safe to remove |
What comes next
In the next article on helpme.safeoffice.de, I am looking into the formula itself. The Formula Explorer shows exactly what the MAKEARRAY, LET and LAMBDA functions are doing in a single cell. This includes demonstrating how the Italian holiday calendar is embedded directly into the working day calculation and how named variables make the formula more readable. It also explains why the formula returns NA rather than zero for months where a category has no spending.
This article is intended for anyone who wants to understand not only the results produced by the workbook, but also its thought processes.
About this analysis
This analysis was performed using a special tool on Excel 365 running on Windows computer with a 16-core processor. The analysed workbook is a project cost baseline workbook created for clients in the Italian construction sector, with dummy data used for demonstration purposes.
The analysis tool, workbook check, formula explorer and workbook cleaner are all part of a professional toolkit used for data consulting projects. If you have any questions about analysing or optimising your own Excel files, please visit safeoffice.de or helpme.safeoffice.de.
This article is part of the helpme.safeoffice.de series, which provides practical guides on data solutions, workbook modeling and process documentation. The series is aimed at businesses that want effective, long-lasting tools that everyone can understand.